This online help applies to all versions of the HVAC Psychrometric Chart iPad app including the ASHRAE- and Carmel-branded versions.
It is the first truly interactive graphical psychrometric chart for the iPad, and it includes both IP and SI units.
Using your finger, you can easily plot HVAC and other psychrometric processes on the iPad screen while you are out in the field, save the graphs, and then email the graph and results to yourself or clients. The following help addresses all of the features in the app:
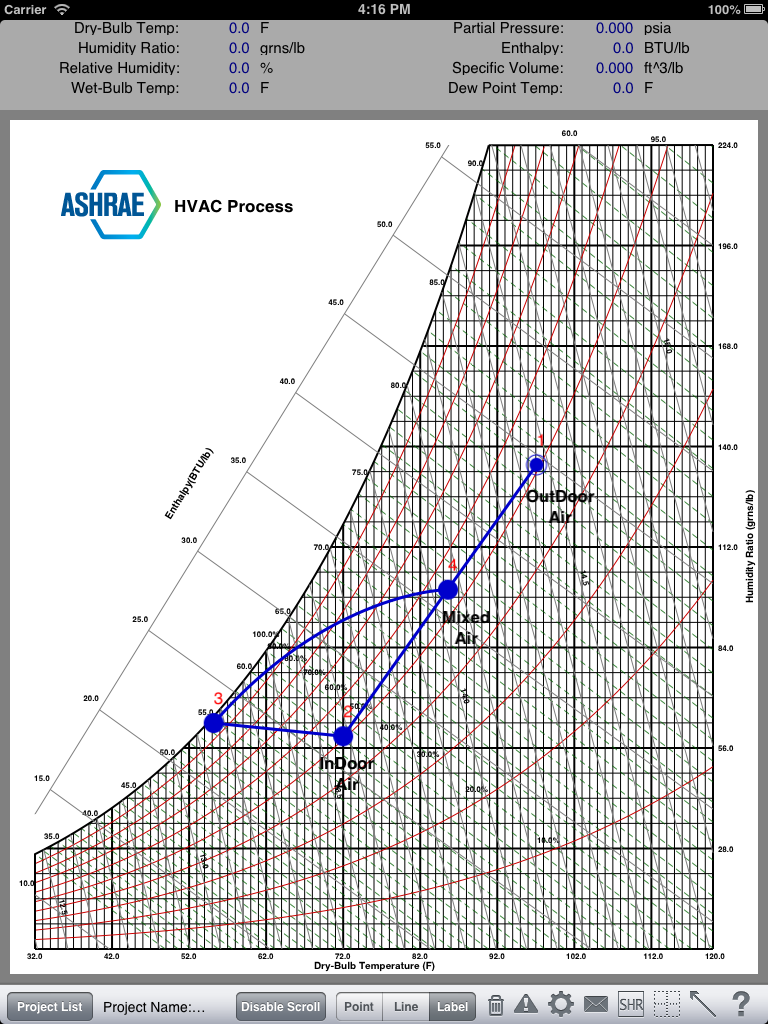
When you first open the app, the main psychrometric chart appears. You can use the app in either the landscape or portrait orientation. The graph fits best in landscape orientation, so this tutorial will display all screenshots in landscape:
Select a Project
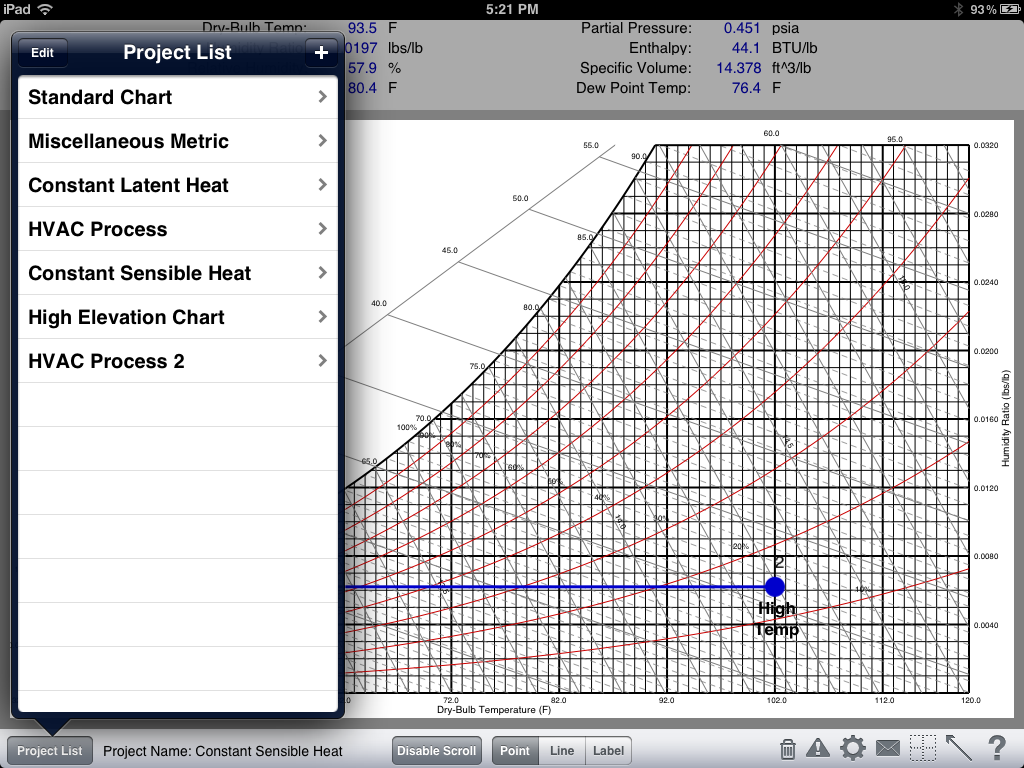
To select a project from the Project List, just select the project name using yor finger, and the project will appear on the iPad screen.
Add a Project
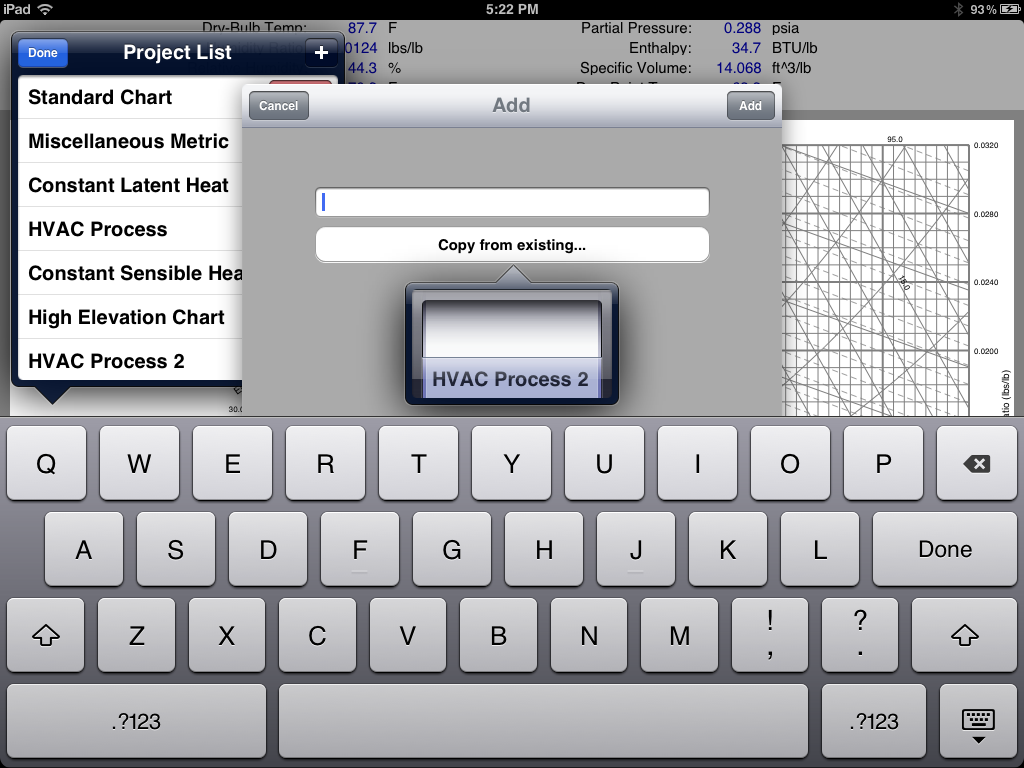
To add a project, click the plus button. A new form will appear allowing you to type in the new project name. You can also copy an existing project to a new project. To do this, click the "Copy from existing" button to display a list of all existing projects, and select the project name that you want to copy from. After you are done, click the "Add" button to add the new project. The Project List form will disappear, and the newly added project will display on the screen.
Delete a Project
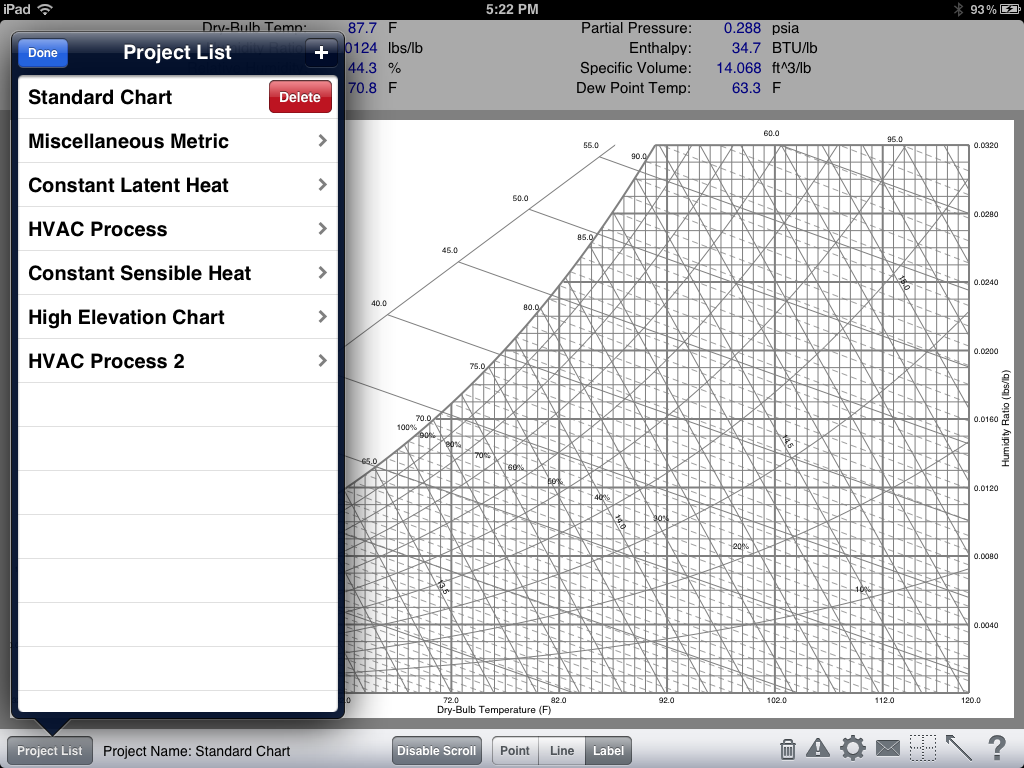
To delete a project, either click the "Edit" button located on the Project List form or swipe the project name, and the Delete button will appear next to the project name. Click this button to delete it.
Point
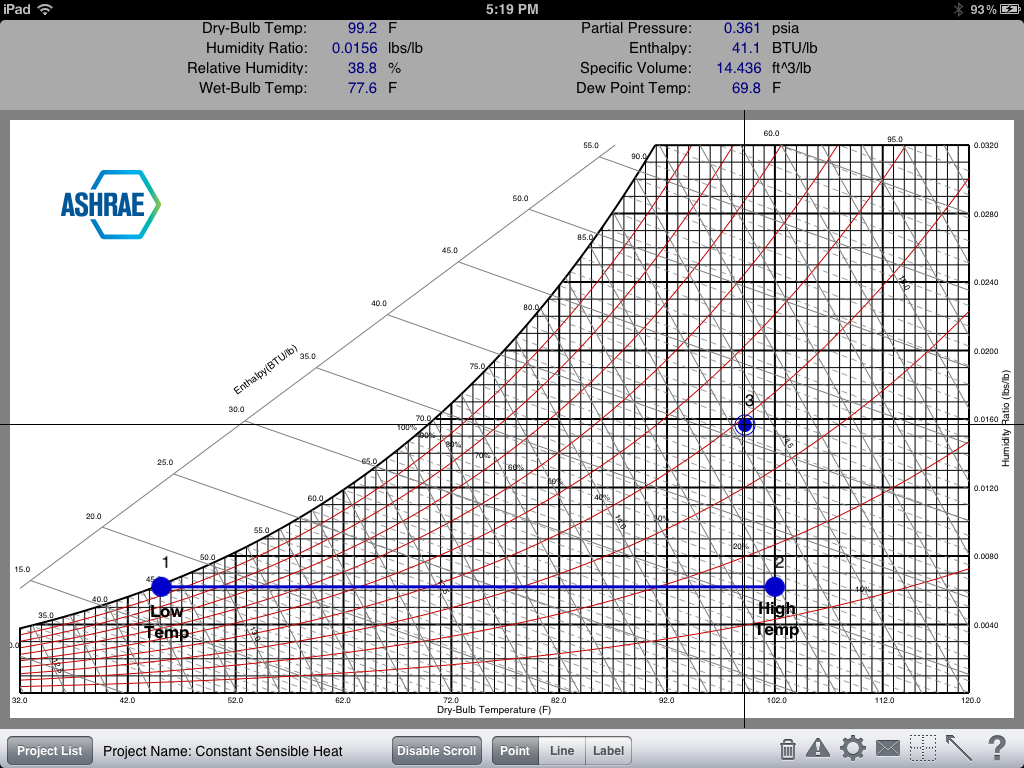
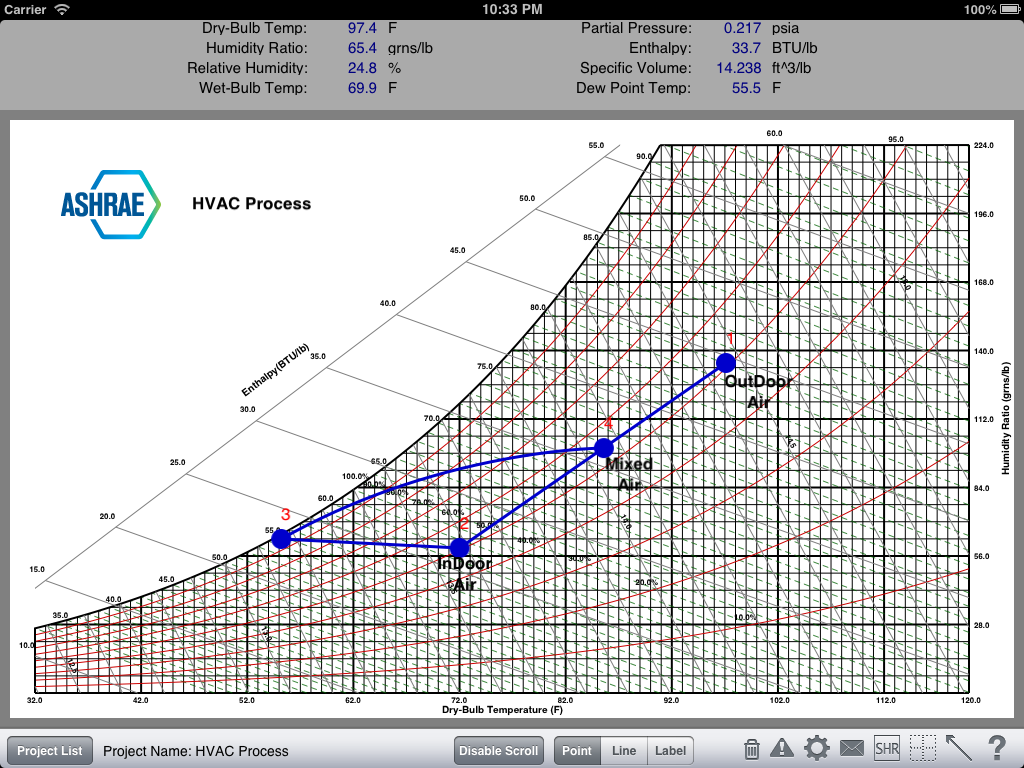
The Point mode allows you to plot individual psychrometric points by moving your finger around the iPad screen. When you reach a position on the graph where you want to plot a point, just double-tap the screen and the point will anchor to that position. If you wish to move the point around the chart, just tap it once and move your finger. You will notice that when you add points, they are automatically assigned numbers. These numbers are used to reference the points in the Point Properties Form. To delete a point, just select it once, then click the garbage can icon located in the lower right-hand corner of the screen.
To display the Point Properties Form, double-tap the point. This form allows you to tweak the exact properties of the point or enter additional information about it:
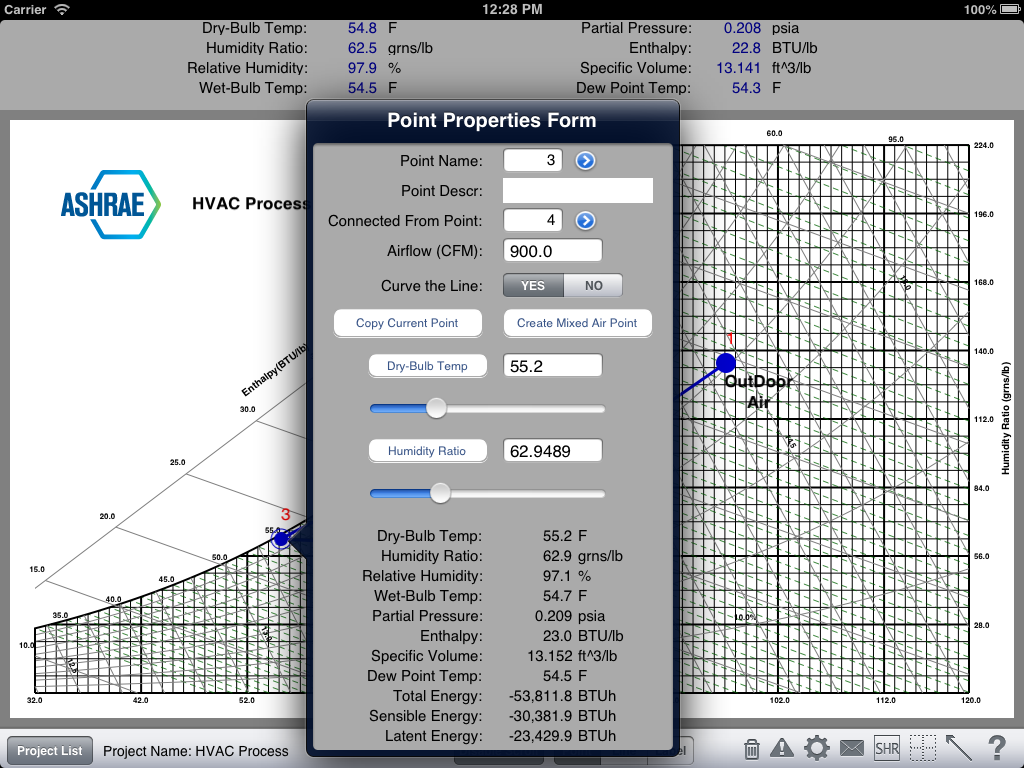
The following is an explanation of the Point Properties Form:
Point Name: This input displays the currently selected point (by its numerical reference). If you wish to edit another point, select the blue button next to the input to display a picker control that allows you to select another point.
Point Description: Enter descriptive text about the point. It is displayed in the email report, only.
Connected From Point: This input displays the point number that the current point is connected from by a process line. If you wish to change the point it is connected from, press the blue button to display a picker control to select another point. If no process line is connected to the point, then this option is blank.
Airflow (CFM or L/s): Enter the airflow value if this point is connected to another point by a process line. If so, the total, sensible, and latent energy results will be calculated.
Curve the Line: Click Yes or No to cause a process line that is connected to this point from another point to curve. This best represents the path the air travels as it cools (especially along the 100% saturation line).
Copy Current Point: Click this button to copy the current point to a new point with the exact same psychrometric properties. After you click this button, the new point will be selected, and you will be able to update its properties.
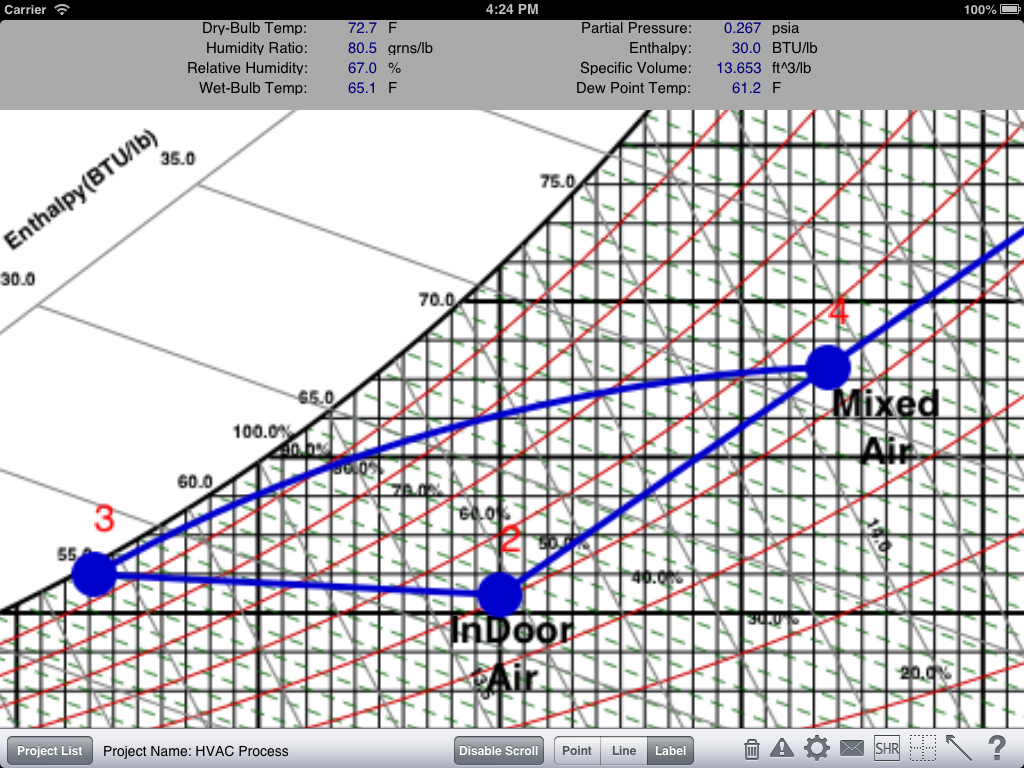
Create Mixed Air Point: This button is only displayed if the point is connected to another point by a process line. Click this button to create a mixed air point that is calculated by taking the psychrometric properties of both points and the ratios of the airflows.
Psychrometric Property Buttons: The final two inputs on the Point Properties Form allow you to specify the psychrometric properties of the point. Press the buttons that have the psychrometric property labels located on them, and they toggle from one property to another. This allows you to specify up to 20 different combinations of properties for the point. Once you have selected a property you want to input for, either enter the value into the text box using the onscreen keyboard or slide the slider control indicator to increase or decrease the value. The results at the bottom of the form will immediately update. Also, you will notice that the point on the chart moves, too.
Results at Bottom of the Form: The calculated results appear at the bottom of the form. Eight psychrometric properties appear along with their units. Also, if the point is part of a process, then the total, sensible, and latent energy loads appear.
Line
The Line mode allows you to draw process lines from one point to another, thereby creating psychrometric processes and calculating total energy results (see above). To draw a line from one point to another, make sure you are in the Line mode. Then, tap the point that you want to draw a line FROM and drag that line to the point you want to draw to. You will notice that an arrow appears at the end of the line. This tells you the direction that the line was drawn. This is important because you can draw as many lines FROM a point that you want. However, you can only draw one line TO a point. To get rid of a line, go into the Point Properties Form of the point that the line is drawn TO, and select no point number from the Connected From Point control. If you want to hide the arrows, pressing the icon in the lower-right hand part of the screen (It displays an angled line with an arrow).

Label
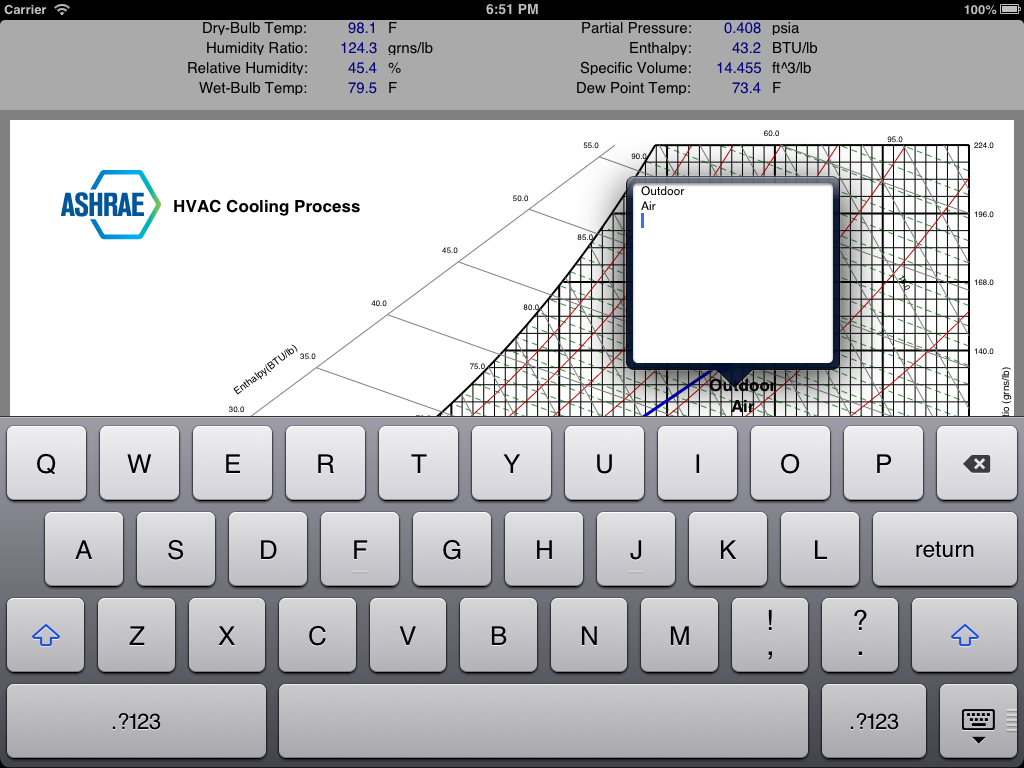
The Label mode allows you to type a text label anywhere on the screen. Make sure you are in the Label mode, then tap the part of the screen where you want a label to appear, and a label box will display that allows you to type in text. This is great for adding labels to points and lines.
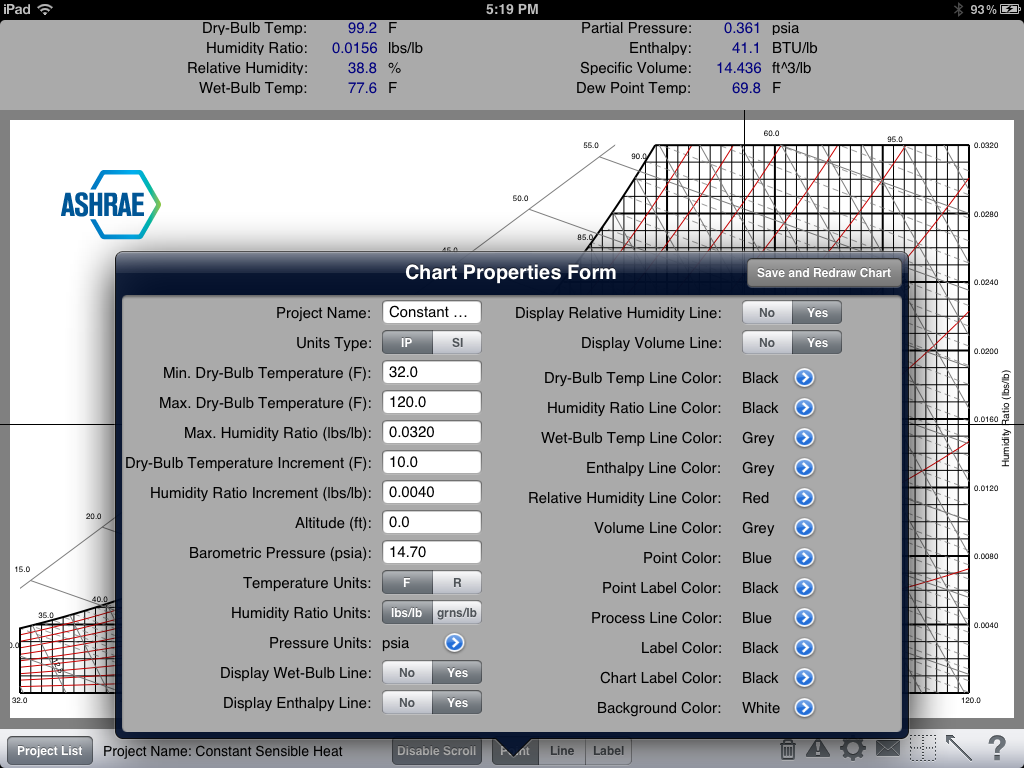
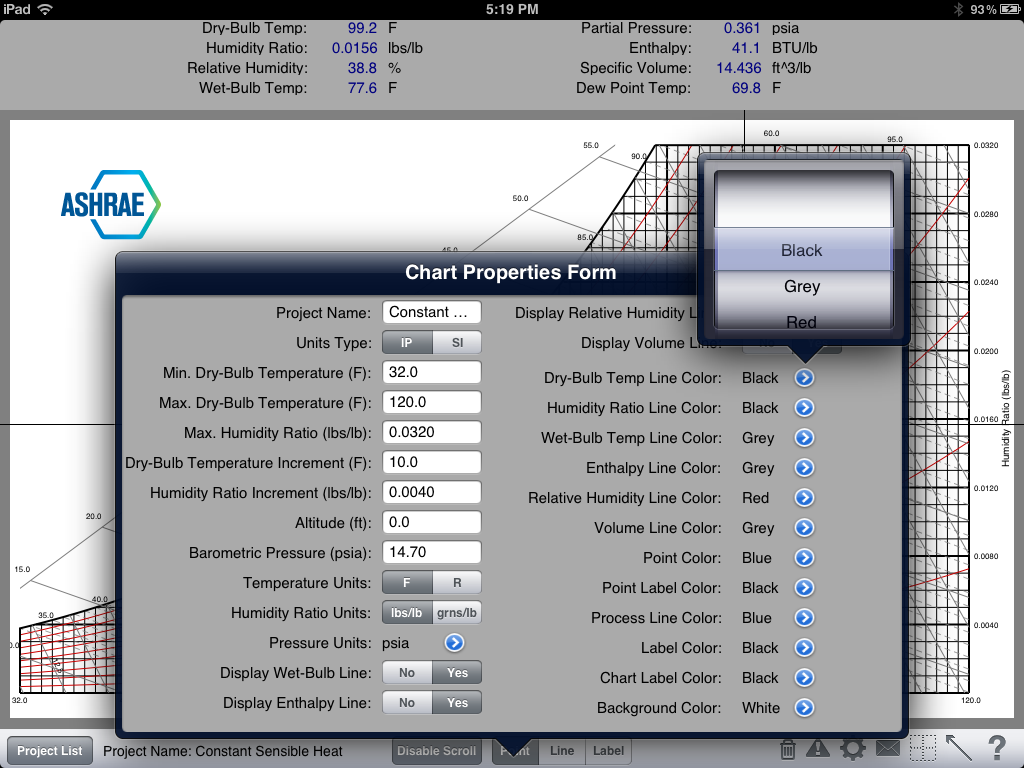
This form allows you to completely customize the psychrometric graph in a number of different ways. The following is an explanation of each of the selections:
Project Name: This input allows you to change the name of the project. If you update the project name, it will be reflected in the Project List form.
Units Type: This selector allows you to choose whether to display all units in either English (IP) or Metric (SI). All values and labels will immediately update based upon your selection.
Min. Dry-Bulb Temperature (F): This input specifies the minimum dry-bulb temperature that is displayed on the x-axis of the chart. As you go lower, the chart will expand horizontally to accommodate the lower temperatures.
Max. Dry-Bulb Temperature (F): This input specifies the maximum dry-bulb temperature that is displayed on the x-axis of the chart. As you go higher, the chart will expand horizontally to accommodate the higher temperatures. You are limited to about 450 degrees F.
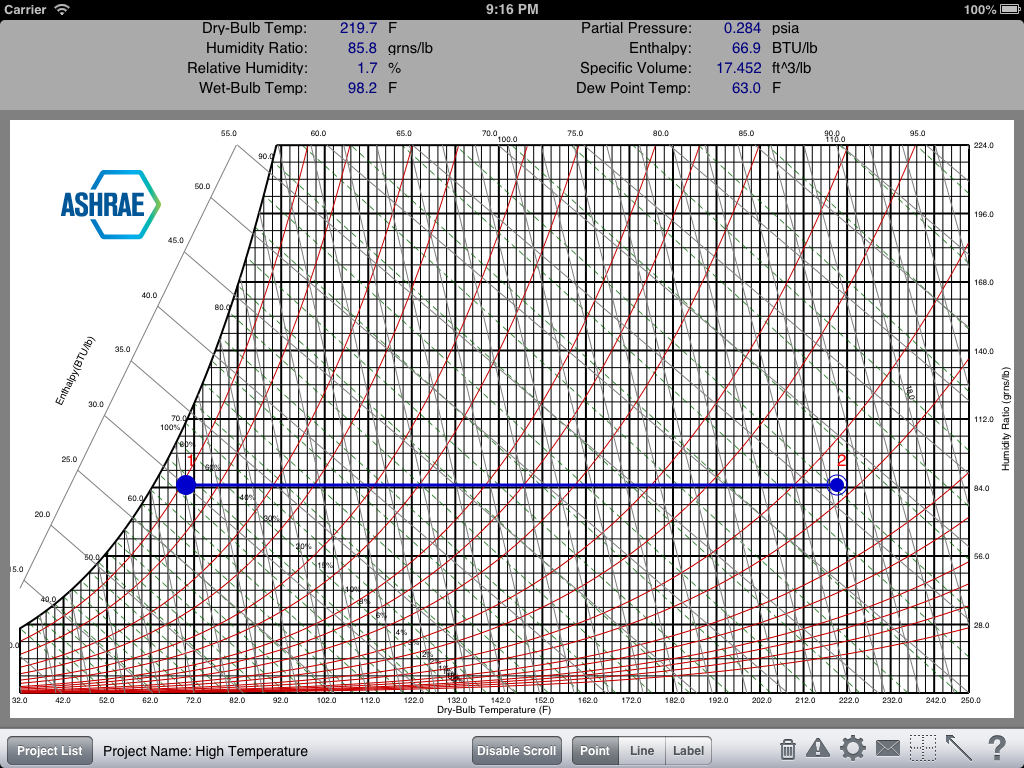
Max. Humidity Ratio (lbs/lb): This input specifies the maximum humidity ratio value that is displayed on the y-axis of the chart. As you go higher, the chart will expand vertically to accommodate the higher humidity ratios.
Dry-Bulb Temperature Increment (F): Input the dry-bulb temperature display increment along the x-axis. The higher the number, the lower the number of x-axis temperature values are displayed.
Humidity Ratio Increment (lbs/lb): Input the humidity ratio display increment along the y-axis. The higher the number, the lower the number of y-axis humidity ratio values are displayed.
Altitude (ft): Input the altitude of the air that you are modelling with the chart. This value will update the barometric pressure input described next. Changes in the barometric pressure can drastically affect the layout of the chart, so it is important to enter the correct elevation and barometric pressure.
Barometric Pressure (psia): This input is automatically updated according to the altitude entered above. However, you can override it by inputting a specific barometric pressure. Changes in the barometric pressure can drastically affect the layout of the chart, so it is important to enter the correct elevation and barometric pressure.
Temperature Units: This selector control allows you to select the units that all temperature values are displayed in. In English, select either "F" for Fahrenheit or "R" for Rankine. In Metric, select either "C" for Celsius or "K" for Kelvin.
Humidity Ratio Units: This selector control allows you to select the units that all humidity ratio values are displayed in. In English, select either lbs/lb or grains/lb. In Metric, select either kgs/kg or g/kg.
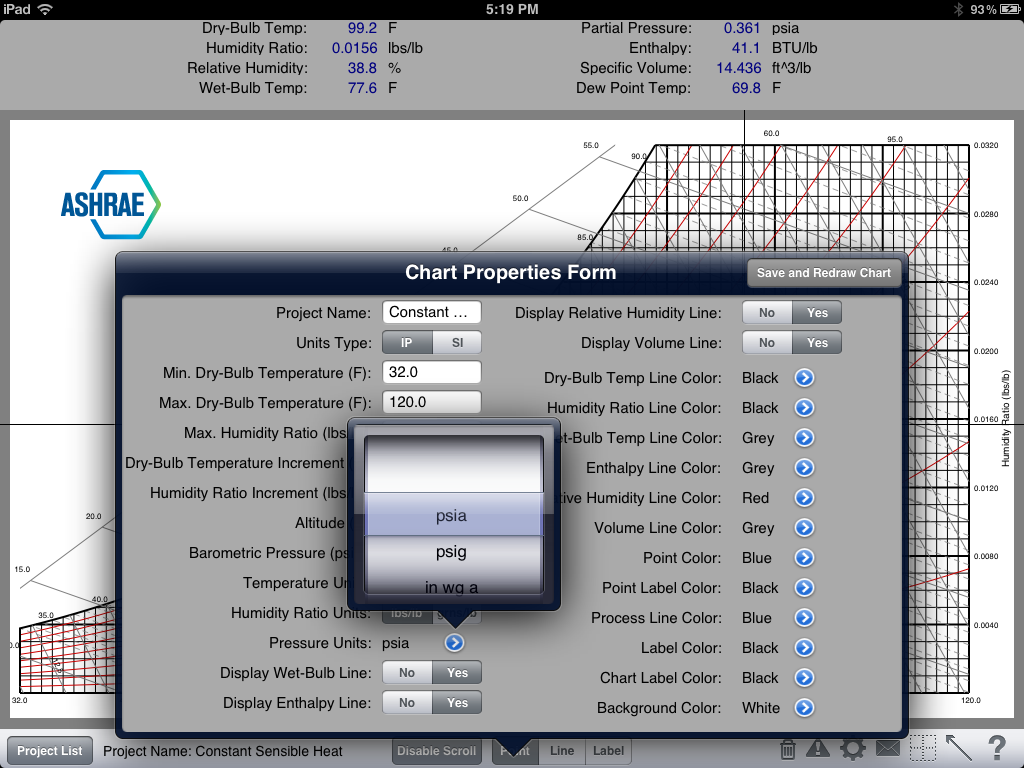
Pressure Units: This picker control allows you to select from a wide variety of pressure units for either English or Metric.
Display Wet-Bulb Lines: This selector control allows you to display or hide the wet-bulb lines on the psychrometric chart. Select "No" to hide the wet-bulb lines. Select "Yes" to display the wet-bulb lines.
Display Enthalpy Lines: This selector control allows you to display or hide the enthalpy lines on the psychrometric chart. Select "No" to hide the enthalpy lines. Select "Yes" to display the enthalpy lines.
Display Relative Humidity Lines: This selector control allows you to display or hide the relative humidity lines on the psychrometric chart. Select "No" to hide the relative humidity lines. Select "Yes" to display the relative humidity lines.
Display Volume Lines: This selector control allows you to display or hide the volume lines on the psychrometric chart. Select "No" to hide the volume lines. Select "Yes" to display the volume lines.
Line Colors: The next 6 inputs allow you to select the various chart line colors. All of them are gray by default. However, you can also select black, red, blue, green, yellow or white. This functionality allows you to highlight certain lines while making other lines not as obvious.
Point Color: This option allows you to select the psychrometric point color.
Point Label Color: This option allows you to select the psychrometric point label (i.e. - 1, 2, 3, etc.) color.
Process Line Color: This option allows you to select the psychrometric process line color.
Label Color: This option allows you to select the color of the labels that you can add to the chart.
Chart Label Color: This option allows you to select the color of the chart labels that appear on the x- and y-axis and also throughout the chart.
Background Color: This option allows you to select the screen background color.
After you have completed specifying all of the settings, click the "Save and Redraw Chart" button to refresh the chart.
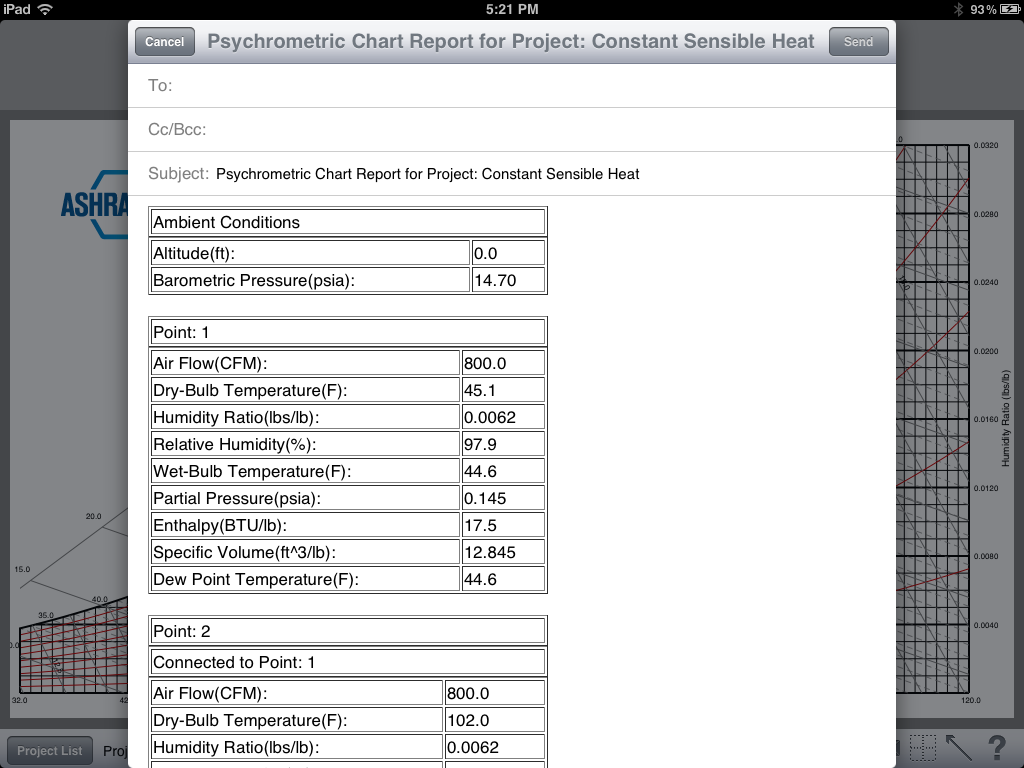
The email includes a list of all the points and their respective properties. In addition, it includes a spreadsheet file with this same information and a PDF attachment of the chart, itself.
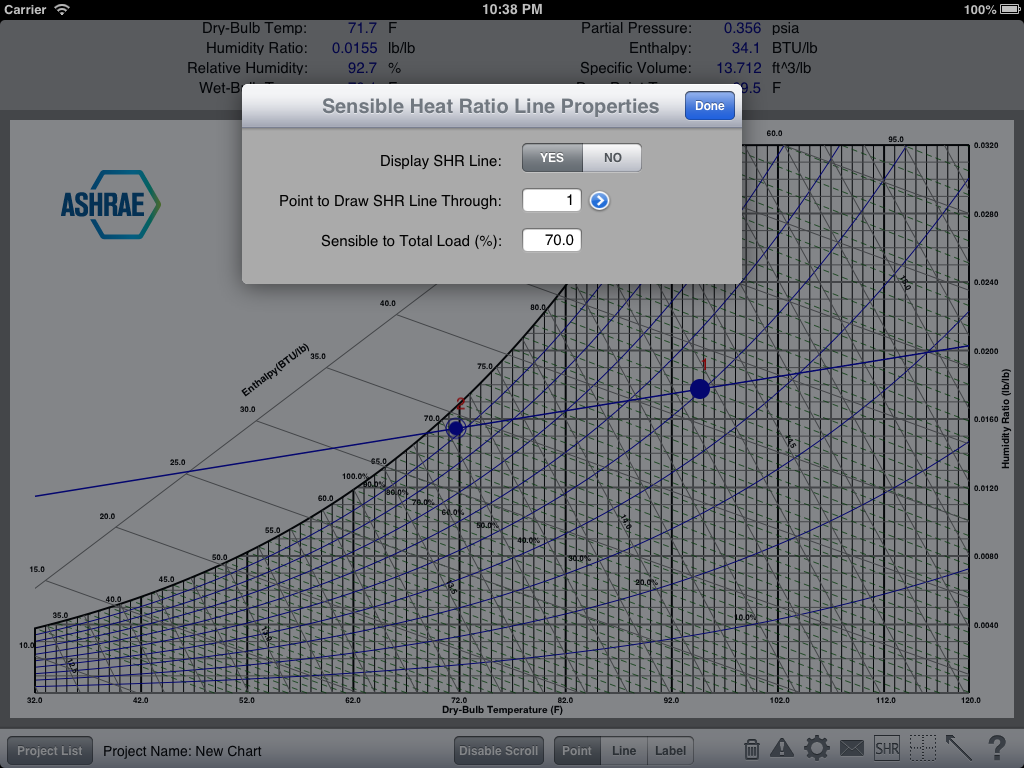
Display SHR Line: Select Yes or No to display or hide the SHR line. This setting is universal to all psychrometric projects, so if you select another project, it will display/hide the line also.
Point to Draw SHR Line Through: From this dropdown, select the process point to draw the SHR line through.
Sensible to Total Load: Enter the percentage of the sensible cooling load to the total cooling load. This determines the angle of the SHR line.
After pressing "Done", SHR line will display at an angle through the appropriate point. Now, when you add a new or move an existing point, that point will automatically move along the SHR line. When you are finished, return to the SHR form and turn off the line.
Using your finger, you can easily plot HVAC and other psychrometric processes on the iPad screen while you are out in the field, save the graphs, and then email the graph and results to yourself or clients. The following help addresses all of the features in the app:
When you first open the app, the main psychrometric chart appears. You can use the app in either the landscape or portrait orientation. The graph fits best in landscape orientation, so this tutorial will display all screenshots in landscape:


Psychrometric Projects
The HVAC Psych Chart app allows you to create psychrometric projects. Each project has its own set of points, process lines, and chart characteristics. For example, you can create one project that includes points and a line representing a simple sensible heat process. In addition, this project could display all the psychrometric chart lines is black and the text as green. Another project may represent a complex HVAC cooling process, and all psychrometric chart lines are gray with red text. To select, create, or delete a psychrometric project, click the "Project List" button located in the lower left-hand portion of the screen. This displays the entire list of projects.
Select a Project
To select a project from the Project List, just select the project name using yor finger, and the project will appear on the iPad screen.
Add a Project
To add a project, click the plus button. A new form will appear allowing you to type in the new project name. You can also copy an existing project to a new project. To do this, click the "Copy from existing" button to display a list of all existing projects, and select the project name that you want to copy from. After you are done, click the "Add" button to add the new project. The Project List form will disappear, and the newly added project will display on the screen.

Delete a Project
To delete a project, either click the "Edit" button located on the Project List form or swipe the project name, and the Delete button will appear next to the project name. Click this button to delete it.

Psychrometric Modes
There are three modes by which you can use the chart:- Point
- Line
- Label
Point
The Point mode allows you to plot individual psychrometric points by moving your finger around the iPad screen. When you reach a position on the graph where you want to plot a point, just double-tap the screen and the point will anchor to that position. If you wish to move the point around the chart, just tap it once and move your finger. You will notice that when you add points, they are automatically assigned numbers. These numbers are used to reference the points in the Point Properties Form. To delete a point, just select it once, then click the garbage can icon located in the lower right-hand corner of the screen.
To display the Point Properties Form, double-tap the point. This form allows you to tweak the exact properties of the point or enter additional information about it:

The following is an explanation of the Point Properties Form:
Point Name: This input displays the currently selected point (by its numerical reference). If you wish to edit another point, select the blue button next to the input to display a picker control that allows you to select another point.
Point Description: Enter descriptive text about the point. It is displayed in the email report, only.
Connected From Point: This input displays the point number that the current point is connected from by a process line. If you wish to change the point it is connected from, press the blue button to display a picker control to select another point. If no process line is connected to the point, then this option is blank.
Airflow (CFM or L/s): Enter the airflow value if this point is connected to another point by a process line. If so, the total, sensible, and latent energy results will be calculated.
Curve the Line: Click Yes or No to cause a process line that is connected to this point from another point to curve. This best represents the path the air travels as it cools (especially along the 100% saturation line).
Copy Current Point: Click this button to copy the current point to a new point with the exact same psychrometric properties. After you click this button, the new point will be selected, and you will be able to update its properties.
Create Mixed Air Point: This button is only displayed if the point is connected to another point by a process line. Click this button to create a mixed air point that is calculated by taking the psychrometric properties of both points and the ratios of the airflows.
Psychrometric Property Buttons: The final two inputs on the Point Properties Form allow you to specify the psychrometric properties of the point. Press the buttons that have the psychrometric property labels located on them, and they toggle from one property to another. This allows you to specify up to 20 different combinations of properties for the point. Once you have selected a property you want to input for, either enter the value into the text box using the onscreen keyboard or slide the slider control indicator to increase or decrease the value. The results at the bottom of the form will immediately update. Also, you will notice that the point on the chart moves, too.
Results at Bottom of the Form: The calculated results appear at the bottom of the form. Eight psychrometric properties appear along with their units. Also, if the point is part of a process, then the total, sensible, and latent energy loads appear.
Line
The Line mode allows you to draw process lines from one point to another, thereby creating psychrometric processes and calculating total energy results (see above). To draw a line from one point to another, make sure you are in the Line mode. Then, tap the point that you want to draw a line FROM and drag that line to the point you want to draw to. You will notice that an arrow appears at the end of the line. This tells you the direction that the line was drawn. This is important because you can draw as many lines FROM a point that you want. However, you can only draw one line TO a point. To get rid of a line, go into the Point Properties Form of the point that the line is drawn TO, and select no point number from the Connected From Point control. If you want to hide the arrows, pressing the icon in the lower-right hand part of the screen (It displays an angled line with an arrow).

Label
The Label mode allows you to type a text label anywhere on the screen. Make sure you are in the Label mode, then tap the part of the screen where you want a label to appear, and a label box will display that allows you to type in text. This is great for adding labels to points and lines.

Chart Properties Form
The Chart Properties Form is accessed by pressing the "gear" icon located in the lower right-hand corner of the screen. The following form appears:
This form allows you to completely customize the psychrometric graph in a number of different ways. The following is an explanation of each of the selections:
Project Name: This input allows you to change the name of the project. If you update the project name, it will be reflected in the Project List form.
Units Type: This selector allows you to choose whether to display all units in either English (IP) or Metric (SI). All values and labels will immediately update based upon your selection.
Min. Dry-Bulb Temperature (F): This input specifies the minimum dry-bulb temperature that is displayed on the x-axis of the chart. As you go lower, the chart will expand horizontally to accommodate the lower temperatures.
Max. Dry-Bulb Temperature (F): This input specifies the maximum dry-bulb temperature that is displayed on the x-axis of the chart. As you go higher, the chart will expand horizontally to accommodate the higher temperatures. You are limited to about 450 degrees F.

Max. Humidity Ratio (lbs/lb): This input specifies the maximum humidity ratio value that is displayed on the y-axis of the chart. As you go higher, the chart will expand vertically to accommodate the higher humidity ratios.
Dry-Bulb Temperature Increment (F): Input the dry-bulb temperature display increment along the x-axis. The higher the number, the lower the number of x-axis temperature values are displayed.
Humidity Ratio Increment (lbs/lb): Input the humidity ratio display increment along the y-axis. The higher the number, the lower the number of y-axis humidity ratio values are displayed.
Altitude (ft): Input the altitude of the air that you are modelling with the chart. This value will update the barometric pressure input described next. Changes in the barometric pressure can drastically affect the layout of the chart, so it is important to enter the correct elevation and barometric pressure.
Barometric Pressure (psia): This input is automatically updated according to the altitude entered above. However, you can override it by inputting a specific barometric pressure. Changes in the barometric pressure can drastically affect the layout of the chart, so it is important to enter the correct elevation and barometric pressure.
Temperature Units: This selector control allows you to select the units that all temperature values are displayed in. In English, select either "F" for Fahrenheit or "R" for Rankine. In Metric, select either "C" for Celsius or "K" for Kelvin.
Humidity Ratio Units: This selector control allows you to select the units that all humidity ratio values are displayed in. In English, select either lbs/lb or grains/lb. In Metric, select either kgs/kg or g/kg.
Pressure Units: This picker control allows you to select from a wide variety of pressure units for either English or Metric.

Display Wet-Bulb Lines: This selector control allows you to display or hide the wet-bulb lines on the psychrometric chart. Select "No" to hide the wet-bulb lines. Select "Yes" to display the wet-bulb lines.
Display Enthalpy Lines: This selector control allows you to display or hide the enthalpy lines on the psychrometric chart. Select "No" to hide the enthalpy lines. Select "Yes" to display the enthalpy lines.
Display Relative Humidity Lines: This selector control allows you to display or hide the relative humidity lines on the psychrometric chart. Select "No" to hide the relative humidity lines. Select "Yes" to display the relative humidity lines.
Display Volume Lines: This selector control allows you to display or hide the volume lines on the psychrometric chart. Select "No" to hide the volume lines. Select "Yes" to display the volume lines.
Line Colors: The next 6 inputs allow you to select the various chart line colors. All of them are gray by default. However, you can also select black, red, blue, green, yellow or white. This functionality allows you to highlight certain lines while making other lines not as obvious.

Point Color: This option allows you to select the psychrometric point color.
Point Label Color: This option allows you to select the psychrometric point label (i.e. - 1, 2, 3, etc.) color.
Process Line Color: This option allows you to select the psychrometric process line color.
Label Color: This option allows you to select the color of the labels that you can add to the chart.
Chart Label Color: This option allows you to select the color of the chart labels that appear on the x- and y-axis and also throughout the chart.
Background Color: This option allows you to select the screen background color.
After you have completed specifying all of the settings, click the "Save and Redraw Chart" button to refresh the chart.
Send an Email
After you have customized the chart and added all of the points and process lines, you can send an email. Do this by clicking the envelope icon in the bottom right-hand corner of the screen.
The email includes a list of all the points and their respective properties. In addition, it includes a spreadsheet file with this same information and a PDF attachment of the chart, itself.
Sensible Heat Ratio (SHR) Line
The app allows you to display a sensible heat ratio (SHR) line so you can plot process points along it. The angle of the sensible heat ratio line is equal to the sensible to total heat gain %. To display and set the SHR line, click the "SHR" icon located in the bottom right-hand corner of the app. It displays the form in the screenshot below.Display SHR Line: Select Yes or No to display or hide the SHR line. This setting is universal to all psychrometric projects, so if you select another project, it will display/hide the line also.
Point to Draw SHR Line Through: From this dropdown, select the process point to draw the SHR line through.
Sensible to Total Load: Enter the percentage of the sensible cooling load to the total cooling load. This determines the angle of the SHR line.
After pressing "Done", SHR line will display at an angle through the appropriate point. Now, when you add a new or move an existing point, that point will automatically move along the SHR line. When you are finished, return to the SHR form and turn off the line.

Other Functionality
Other interesting functionality includes:- To clear the entire chart, click the second icon from the left in the lower right-hand corner of the screen. You will be asked for confirmation prior to the screen be cleared.
- You will notice that as you move your finger around the chart that a cross-hair is displayed that allows you to see where it crosses the x- and y-axis. You can toggle on or off this cross-hair by clicking the cross-hair icon in the lower right-hand corner of the screen.
- There is a button called "Disable/Enable Scroll" located on the bottom of the screen. This turns on or off the scroll capabilities of the chart when you are zoomed in. When you are zoomed in, and if the scroll is enabled then you will be able to pan around the chart. If it is disabled, you will not be able to pan around the chart, but you will be able to easily move points.
- You can zoom in or out of the chart by "pinching" the chart with your finger.
